R allows you to create different plot types, ranging from the basic graph types like density plots, dot plots, bar charts, line charts, pie charts, boxplots and scatter plots, to the more statistically complex types of graphs such as probability plots, mosaic plots and correlograms.
In addition, R is pretty known for its data visualization capabilities: it allows you to go from producing basic graphs with little customization to plotting advanced graphs with full-blown customization in combination with interactive graphics. Nevertheless, not always do we get the results that we want for our R plots: Stack Overflow is flooded with our questions on plots, with many recurring questions.
This is why DataCamp decided to put all the frequently asked questions and their top rated answers together in a blog post, completed with additional, short explanations that could be of use for R beginners.
![question]()
If you are rather interested in learning how to plot with R, you might consider reading our tutorial on histograms, which covers basic R, ggplot2 and ggvis, or this shorter tutorial which offers an overview of simple graphs in R. However, if you’re looking to learn everything on creating stunning and informative graphical visualizations, our interactive course on (interactive) data visualization with ggvis will definitely interest you!
1. How To Draw An Empty R Plot?
How To Open A New Plot Frame
You can open an empty plot frame and activate the graphics device in R as follows:
plot.new() # or frame()
Note that the plot.new() and frame() functions define a new plot frame without it having any axes, labels, or outlining. It indicates that a new plot is to be made: a new graphics window will open if you don’t have one open yet, otherwise the existing window is prepared to hold the new plot. You can read up on these functions here.
x11() can also opens a new windows device in R for the X Window System (version 11)!quartz() starts a graphics device driver for the OS X System.windows() starts a new graphics device for Windows.
How To Set Up The Measurements Of The Graphics Window
You can also use the plot.window() function to set the horizontal and vertical dimensions of the empty plot you just made:
pWidth = 3
pHeight = 2
plot.window(c(0,pWidth),
            c(0,pHeight))
How To Draw An Actual Empty Plot
You can draw an empty plot with the plot() function:
plot(5,
     5,
     type="n",
     axes=FALSE,
     ann=FALSE,
     xlim=c(0, 10),
     ylim = c(0,10))
You give the coordinates (5,5) for the plot, but that you don’t show any plotting by putting the type argument to "n".
(Tip: try to put this argument to "p" or "b" and see what happens!)
What’s more, you don’t annotate the plot, but you do put limits from 0 to 10 on the x- and y-axis. Next, you can fill up your empty plot with axes, axes labels and a title with the following commands:
mtext("x-axis",
      side=1) #Add text to the x-axis
mtext("y-axis",
      side=2)
title("An R Plot") #Add a title
Note that if you want to know more about the side argument, you can just keep on reading! It will be discussed in more detail below, in question 3 about R plots.
Lastly, you may choose to draw a box around your plot by using the box() function and add some points to it with the points() function:
box() #Draw a box
points(5,  #Put (red) point in the plot at (5,5)
       5,
       col="red")
points(5,
       7,
       col="orange",
       pch=3,
       cex=2)
points(c(0, 0, 1),
       c(2, 4, 6),
       col="green",
       pch=4)
Note that you can put your x-coordinates and y-coordinates in vectors to plot multiple points at once. The pch argument allows you to select a symbol, while the cex argument has a value assigned to it that indicates how much the plotted text and symbols should be scaled with respect to the default.
Tip: if you want to see what number links to what symbol, click here.
2. How To Set The Axis Labels And Title Of The R Plots?
The axes of the R plots make up one of the most popular topics of Stack Overflow questions; The questions related to this topic are very diverse. Keep on reading to find out what type of questions DataCamp has found to be quite common!
How To Name Axes (With Up- Or Subscripts) And Put A Title To An R Plot?
You can easily name the axes and put a title in place to make your R plot more specific and understandable for your audience.
This can be easily done by adding the arguments main for the main title, sub for the subtitle, xlab for the label of the x-axis and ylab for the label of the y-axis:
x <- seq(0,2*pi,0.1)
y <- sin(x)
plot(x,
     y,
     main="main title",
     sub="sub-title",
     xlab="x-axis label",
     ylab="y-axis label")
Note that if you want to have a title with up-or subscripts, you can easily add these with the following commands:
plot(1,
     1,
     main=expression("title"^2)) #Upscript
plot(1,
     1,
     main=expression("title"[2])) #Subscript
This all combined gives you the following plot:
![Rplot1]()
Good to know: for those who want to have Greek letters in your axis labels, the following code can be executed:
x <- seq(0,2*pi,0.1)
y <- sin(x)
plot(x,
     y,
     xlab = expression(paste("Greek letter ", phi)),
     ylab = expression(paste("Greek letter ",mu)))
How To Adjust The Appearance Of The Axes’ Labels
To adjust the appearance of the x-and y-axis labels, you can use the arguments col.lab and cex.lab. The first argument is used to change the color of the x-and y-axis labels, while the second argument is used to determine the size of the x-and y-axis labels, relative to the (default) setting of cex.
x <- seq(0,2*pi,0.1)
y <- sin(x)
plot(x,
     y,
     main=expression("main title"^2),
     sub=expression("sub-title"[2]),
     xlab="x-axis label",
     ylab="y-axis label",
     col.lab="blue",
     cex.lab=0.75)
![Rplot2]()
For more information on these arguments, go to this page.
How To Remove A Plot’s Axis Labels And Annotations
If you want to get rid of the axis values of a plot, you can first add the arguments xaxt and yaxt, set as "n". These arguments are assigned a character which specifies the x-axis type. If you put in an "n", like in the command below, you can suppress the plotting of the axis.
Note that by giving any other character to the xaxt and yaxt arguments, the x-and y-axes are plotted.
Next, you can add the annotation argument ann and set it to FALSE to make sure that any axis labels are removed.
x <- seq(0,2*pi,0.1)
y <- sin(x)
plot(x,
     y,
     xaxt="n",
     yaxt="n",
     ann=FALSE)
![Rplot3]()
Tip: not the information you are looking for? Go to this page.
How To Rotate A Plot’s Axis Labels
You can add the las argument to the axis() function to rotate the numbers that correspond to each axis:
x <- seq(0,2*pi,0.1)
y <- sin(x)
plot(x,
     y,
     axes=FALSE)
box()
axis(2,
     las=2)
axis(1,
     las=0)
![Rplot4]()
Note how this actually requires you to add an argument to the plot() function that basically says that there are no axes to be plotted (yet): this is the task of the two axis() function that come next.
The las argument can have three values attributed to it. According to whichever option you choose, the placement of the label will differ: if you choose 0, the label will always be parallel to the axis (which is the default); If you choose 1, the label will be put horizontally. Pick 2 if you want it to be perpendicular to the axis and 3 if you want it to be placed vertically.
But there is more. If you want to know more about the possibilities of the axis() function, keep on reading!
How To Move The Axis Labels Of Your R Plot
So, you want to move your axes’ labels around?
No worries, you can do this with the axis() function; As you may have noticed before in this tutorial, this function allows you to first specify where you want to draw the axes. Let’s say you want to draw the x-axis above the plot area and the y-axis to the right of it.
Remember that if you pass 1 or 2 to the axis() function, your axis will be drawn on the bottom and on the left of the plot area. Scroll a bit up to see an example of this in the previous piece of code!
This means that you will want to pass 3 and 4 to the axis() function:
x<-seq(0,2*pi,0.1)
y<-sin(x)
plot(x,
     y,
     axes=FALSE, # Do not plot any axes
     ann=FALSE) # Do not plot any annotations
axis(3)   # Draw the x-axis above the plot area
axis(4)   # Draw the y-axis to the right of the plot area
box()
![Rplot5]()
As you can see, at first, you basically plot x and y, but you leave out the axes and annotations. Then, you add the axes that you want to see and specify their location with respect to the plot.
The flexibility that the axis() function creates for you keeps on growing! Check out the next frequently asked question to see what else you can solve by using this basic R function.
Tip: go to the last question to see more on how to move around text in the axis labels with hjust and vjust!
3. How To Add And Change The Spacing Of The Tick Marks Of Your R Plot
How To Change The Spacing Of The Tick Marks Of Your R Plot
Letting R determine the tick marks of your plot can be quite annoying and there might come a time when you will want to adjust these.
1. Using The axis() Function To Determine The Tick Marks Of Your Plot
Consider the following piece of code:
v1 <- c(0,pi/2,pi,3*pi/2,2*pi) # -> defines position of tick marks.
v2 <- c("0","Pi/2","Pi","3*Pi/2","2*Pi") # defines labels of tick marks.
x <- seq(0,2*pi,0.1)
y <- sin(x)
plot(x,
     y,
     xaxt = "n")
axis(side = 1,
     at = v1,
     labels = v2,
     tck=-.05)
![Rplot6]()
As you can see, you first define the position of the tick marks and their labels. Then, you draw your plot, specifying the x axis type as "n", suppressing the plotting of the axis.
Then, the real work starts:
- The
axis() function allows you to specify the side of the plot on which the axis is to be drawn. In this case, the argument is completed with 1, which means that the axis is to be drawn below. If the value was 2, the axis would be drawn on the left and if the value was 3 or 4, the axis would be drawn above or to the right, respectively;
- The
at argument allows you to indicate the points at which tick marks are to be drawn. In this case, you use the positions that were defined in V1;
- Likewise, the
labels that you want to use are the ones that were specified in V2;
- You adjust the direction of the ticks through
tck: by giving this argument a negative value, you specify that the ticks should appear below the axis.
Tip: try passing a positive value to the tck argument and see what happens!
You can further specify the size of the ticks through tcl and the appearance of the tick labels is controlled with cex.axis, col.axis and font.axis.
v1 <- c(0,pi/2,pi,3*pi/2,2*pi) # -> defines position of tick marks.
v2 <- c("0","Pi/2","Pi","3*Pi/2","2*Pi") # defines labels of tick marks.
x <- seq(0,2*pi,0.1)
y <- sin(x)
plot(x,
     y,
     xaxt = "n")
axis(side = 1,
     at = v1,
     labels = v2,
     tck=-.1,
     tcl = -0.5,
     cex.axis=1.05,
     col.axis="blue",
     font.axis=5)
![Rplot7]()
2. Using Other Functions To Determine The Tick Marks Of Your R Plot
You can also use the par() and plot() functions to define the positions of tickmarks and the number of intervals between them.
Note that then you use the argument xaxp to which you pass the position of the tick marks that are located at the extremes of the x-axis, followed by the number of intervals between the tick marks:
x <- seq(0,2*pi,0.1)
y <- sin(x)
plot(x,
     y,
     xaxp = c(0, 2*pi, 5))
![Rplot8]()
# Or
x <- seq(0,2*pi,0.1)
y <- sin(x)
plot(x,
     y,
     xaxt="n")
par(xaxp= c(0, 2*pi, 2))
axis(1)
![Rplot8b]()
Note that this works only if you use no logarithmic scale. If the log coordinates set as true, or, in other words, if par(xlog=T), the three values that you pass to xaxp have a different meaning: for a small range, n is negative. Otherwise, n is in 1:3, specifying a case number, and x1 and x2 are the lowest and highest power of 10 inside the user coordinates, 10 ^ par(“usr”)[1:2].
An example:
n <- 1
x <- seq(0, 10000, 1)
y <- exp(n)/(exp(n)+x)
par(xlog=TRUE,
    xaxp= c(1, 4, 3))
plot(x,
     y,
     log="x")
![Rplot9]()
In this example, you use the par() function: you set xlog to TRUE and add the xaxp argument to give the coordinates of the extreme tick marks and the number of intervals between them. In this case, you set the minimal value to 1, the maximal value to 4 and you add that the number of intervals between each tick mark should be 3.
Then, you plot x and y, adding the log argument to specify whether to plot the x-or y-axis or both on a log scale. You can pass "x", "y", and "xy" as values to the log arguments to do this.
An example with both axes in logarithmic scale is:
n <- 1
x <- seq(0, 20, 1)
y <- exp(x)/(x)
par(xlog=TRUE,
    xaxp= c(1, 4, 3))
par(ylog=TRUE,
    yaxp= c(1, 11, 2))
plot(x,
     y,
     log="xy")
![Rplot10]()
How To Add Minor Tick Marks To An R Plot
You can quickly add minor tick marks to your plot with the minor.tick() function from the Hmisc package:
plot.new()
library(Hmisc)
minor.tick(nx = 1.5,
           ny = 2,
           tick.ratio=0.75)
- The
nx argument allows you to specify the number of intervals in which you want to divide the area between the major tick marks on the axis. If you pass the value 1 to it, the minor tick marks will be suppressed;
ny allows you to do the same as nx, but then for the y-axis;- The
tick.ratio indicates the ratio of lengths of minor tick marks to major tick marks. The length of the latter is retrieved from par(tck=x).
4. How To Create Two Different X- or Y-axes
The first option is to create a first plot and to execute the par() function with the new argument put to TRUE to prevent R from clearing the graphics device:
set.seed(101)
x <- 1:10
y <- rnorm(10)
z <- runif(10, min=1000, max=10000)
plot(x, y)
par(new = TRUE)
Then, you create the second plot with plot(). You make one of the type
plot(x,
     z,
     type = "l", #Plot with lines
     axes = FALSE, #No axes
     bty = "n", #Box about plot is suppressed
     xlab = "",  #No labels on x-and y-axis
     ylab = "")
Note that the with axes argument has been put to FALSE, while you also lave the x- and y-labels blank.
You also add a new axis on the right-hand side by adding the argument side and assigning it the value 4.
Next, you specify the the at argument to indicate the points at which tick-marks need to be drawn. In this case, you compute a sequence of n+1 equally spaced “round” values which cover the range of the values in z with the pretty() function. This ensures that you actually have the numbers from the y-axis from your second plot, which you named z.
Lastly, you add an axis label on the right-hand side:
axis(side=4,
     at = pretty(range(z)))
mtext("z",
      side=4,
      line=3)
Note that the side argument can have three values assigned to it: 1 to place the text to the bottom, 2 for a left placement, 3 for a top placement and 4 to put the text to the right. The line argument indicates on which margin line the text starts.
The end result will be like this:![Rplot11]()
Tip: Try constructing an R plot with two different x-axes! You can find the solution below:
plot.new()
set.seed(101)
x <- 1:10
y <- rnorm(10)
z <- runif(10, min=1000, max=10000)
par(mar = c(5, 4, 4, 4) + 0.3)
plot(x, y)
par(new = TRUE)
plot(z, y, type = "l", axes = FALSE, bty = "n", xlab = "", ylab = "")
axis(side=3, at = pretty(range(z)))
mtext("z", side=3, line=3)
![Rplot12]()
Note that twoord.plot() of the plotrix package and doubleYScale() of the latticeExtra package automate this process:
library(latticeExtra)
chol <- read.table(url("http://assets.datacamp.com/blog_assets/chol.txt"), header = TRUE)
Age <- chol$AGE
Chol <- chol$CHOL
Smoke <- chol$SMOKE
State <- chol$MORT
a <- xyplot(Chol ~ Age|State)
b <- xyplot(Smoke ~ Age|State)
doubleYScale(a, b, style1 = 0, style2 = 3, add.ylab2 = TRUE, columns=3)
![Rplot13]()
Note that the example above is made with this dataset. If you’re not sure how you can import your data, check out our tutorial on importing data in R.
5. How To Add Or Change The R Plot’s Legend?
Adding And Changing An R Plot’s Legend With Basic R
You can easily add a legend to your R plot with the legend() function:
x <- seq(0,pi,0.1)
y1 <- cos(x)
y2 <- sin(x)
plot(c(0,3), c(0,3), type="n", xlab="x", ylab="y")
lines(x, y1, col="red", lwd=2)
lines(x, y2, col="blue", lwd=2)
legend("topright",
       inset=.05,
       cex = 1,
       title="Legend",
       c("Cosinus","Sinus"),
       horiz=TRUE,
       lty=c(1,1),
       lwd=c(2,2),
       col=c("red","blue"),
       bg="grey96")
![Rplot14]()
Note that the arguments pt.cex and title.cex that are described in the documentation of legend() don’t really work. There are some workarounds:
1.Put the title or the labels of the legend in a different font with text.font
x <- seq(0,pi,0.1)
y1 <- cos(x)
y2 <- sin(x)
plot(c(0,3), c(0,3), type="n", xlab="x", ylab="y")
lines(x, y1, col="red", lwd=2)
lines(x, y2, col="blue", lwd=2)
legend("topright",
       inset=.05,
       cex = 1,
       title="Legend",
       c("Cosinus","Sinus"),
       horiz=TRUE,
       lty=c(1,1),
       lwd=c(2,2),
       col=c("red","blue"),
       bg="grey96",
       text.font=3)
![Rplot15]()
2. Draw the legend twice with different cex values
x <- seq(0,pi,0.1)
y1 <- cos(x)
y2 <- sin(x)
plot(c(0,3), c(0,3), type="n", xlab="x", ylab="y")
lines(x, y1, col="red", lwd=2)
lines(x, y2, col="blue", lwd=2)
legend("topright",
       inset=.05,
       c("Cosinus","Sinus"),
       title="",
       horiz=TRUE,
       lty=c(1,1),
       lwd=c(2,2),
       col=c("red","blue"))
legend(2.05, 2.97,
       inset=.05,
       c("",""),
       title="Legend",
       cex=1.15,
       bty="n")
![Rplot16]()
Tip: if you’re interested in knowing more about the colors that you can use in R, check out this very helpful PDF document.
How To Add And Change An R Plot’s Legend And Labels In ggplot2
Adding a legend to your ggplot2 plot is fairly easy. You can just execute the following:
chol <- read.table(url("http://assets.datacamp.com/blog_assets/chol.txt"), header = TRUE)
library(ggplot2)
ggplot(chol, aes(x=chol$WEIGHT, y=chol$HEIGHT)) +
  geom_point(aes(colour = factor(chol$MORT), shape=chol$SMOKE)) +
  xlab("Weight") +
  ylab("Height")
![Rplot17]()
And it gives you a default legend. But, in most cases, you will want to adjust the appearance of the legend some more.
There are two ways of changing the legend title and labels in ggplot2:
1. If you have specified arguments such as colour or shape, or other aesthetics, you need to change the names and labels through scale_color_discrete and scale_shape_discrete, respectively:
chol <- read.table(url("http://assets.datacamp.com/blog_assets/chol.txt"), header = TRUE)
library(ggplot2)
ggplot(chol, aes(x=chol$WEIGHT, y=chol$HEIGHT)) +
  geom_point(aes(colour = factor(chol$MORT),
                 shape = chol$SMOKE)) +
  xlab("Weight") +
  ylab("Height") +
  theme(legend.position=c(1,0.5),
        legend.justification=c(1,1)) +
  scale_color_discrete(name ="Condition",
                       labels=c("Alive", "Dead")) +
  scale_shape_discrete(name="Smoker",
                       labels=c("Non-smoker", "Sigare", "Pipe" ))
![Rplot18]()
Note that you can create two legends if you add the argument shape into the geom_point() function and into the labels arguments!
If you want to move the legend to the bottom of the plot, you can specify the legend.position as "bottom". The legend.justification argument, on the other hand, allows you to position the legend inside the plot.
Tip: check out all kinds of scales that could be used to let ggplot know that other names and labels should be used here.
2. Change the data frame so that the factor has the desired form. For example:
chol <- read.table(url("http://assets.datacamp.com/blog_assets/chol.txt"), header = TRUE)
levels(chol$SMOKE)[levels(chol$SMOKE)=="Non-smoker"] <- "Non-smoker"
levels(chol$SMOKE)[levels(chol$SMOKE)=="Sigare"] <- "Sigare"
levels(chol$SMOKE)[levels(chol$SMOKE)=="Pipe"] <- "Pipe"
names(chol)[names(chol)=="SMOKE"]  <- "Smoker"
You can then use the new factor names to make your plot in ggplot2, avoiding the “hassle” of changing the names and labels with extra lines of code in your plotting.
Tip: for a complete cheat sheet on ggplot2, you can go here.
6. How To Draw A Grid In Your R Plot?
Drawing A Grid In Your R Plot With Basic R
For some purposes, you might find it necessary to include a grid in your plot. You can easily add a grid to your plot by using the grid() function:
x <- c(1,2,3,4,5)
y <- 2*x
plot(x,y)
grid(10,10)
![Rplot19]()
Drawing A Grid In An R Plot With ggplot2
chol <- read.table(url("http://assets.datacamp.com/blog_assets/chol.txt"), header = TRUE)
library(ggplot2)
ggplot(chol, aes(x=chol$WEIGHT, y=chol$HEIGHT)) +
  geom_point(aes(colour = factor(chol$MORT), shape = chol$SMOKE)) +
  xlab("Weight") +
  ylab("Height") +
  scale_color_discrete(name ="Condition", labels=c("Alive", "Dead")) +
  scale_shape_discrete(name="Smoker", labels=c("Non-smoker", "Sigare", "Pipe" )) +
  theme(legend.position=c(1,0.5),
        legend.justification=c(1,1),
        panel.grid.major = element_line(colour = "grey40"),
        panel.grid.minor = element_line(colour = "grey40"))
![Rplot20]()
Tip: if you don’t want to have the minor grid lines, just pass element_blank() to panel.grid.minor. If you want to fill the background up with a color, add the panel.background = element_rect(fill = "navy") to your code, just like this:
library(ggplot2)
ggplot(chol, aes(x=chol$WEIGHT, y=chol$HEIGHT)) +
  geom_point(aes(colour = factor(chol$MORT), shape = chol$SMOKE)) +
  xlab("Weight") +
  ylab("Height") +
  scale_color_discrete(name ="Condition", labels=c("Alive", "Dead")) +
  scale_shape_discrete(name="Smoker", labels=c("Non-smoker", "Sigare", "Pipe" )) +
  theme(legend.position=c(1,0.5),
        legend.justification=c(1,1),
        panel.grid.major = element_line(colour = "grey40"),
        panel.grid.minor = element_line(colour = "grey40"),
        panel.background = element_rect(fill = "navy")
        )
7. How To Draw A Plot With A PNG As Background?
You can quickly draw a plot with a .png as a background with the help of the png package. You install the package if you need to, activate it for use in your workspace through the library function library() and you can start plotting!
install.packages("png")
library(png)
First, you want to load in the image. Use the readPNG() function to specify the path to the picture!
image <- readPNG("<path to your picture>")
Tip: you can check where your working directory is set at and change it by executing the following commands:
getwd()
setwd("<path to a folder>")
If your picture is saved in your working directory, you can just specify readPNG("picture.png") instead of passing the whole path.
Next, you want to set up the plot area:
plot(1:2, type='n', main="Plotting Over an Image", xlab="x", ylab="y")
And you want to call the par() function:
lim <- par()
You can use the par() function to set the graphical parameters in rasterImage(). You use the argument usr to define the extremes of the user coordinates of the plotting region. In this case, you put 1, 3, 2 and 4:
rasterImage(image, lim$usr[1], lim$usr[3], lim$usr[2], lim$usr[4])
Next, you draw a grid and add some lines:
grid()
lines(c(1, 1.2, 1.4, 1.6, 1.8, 2.0), c(1, 1.3, 1.7, 1.6, 1.7, 1.0), type="b", lwd=5, col="red")
This can give you the following result if you use the DataCamp logo:
library(png)
image <- readPNG("datacamp.png")
plot(1:2, type="n", main="Plotting Over an Image", xlab="x", ylab="y", asp=1)
lim <- par()
rasterImage(image, lim$usr[1], lim$usr[3], lim$usr[2], lim$usr[4])
lines(c(1, 1.2, 1.4, 1.6, 1.8, 2.0), c(1.5, 1.3, 1.7, 1.6, 1.7, 1.0), type="b", lwd=5, col="red")
![Rplot21]()
Note that you need to give a .png file as input to readPNG()!
8. How To Adjust The Size Of Points In An R Plot?
Adjusting The Size Of Points In An R Plot With Basic R
To adjust the size of the points with basic R, you might just simply use the cex argument:
x <- c(1,2,3,4,5)
y <- c(6,7,8,9,10)
plot(x,y,cex=2,col="red")
Remember, however, that that R allows you to have much more control over your symbols through the function symbols():
df <- data.frame(x1=1:10,
                 x2=sample(10:99, 10),
                 x3=10:1)
symbols(x=df$x1,
        y=df$x2,
        circles=df$x3,
        inches=1/3,
        ann=F,
        bg="steelblue2",
        fg=NULL)
The circles of this plot receive the values of df$x3 as the radii, while the argument inches controls the size of the symbols. When this argument receives a positive number as input, the symbols are scaled to make largest dimension this size in inches.
Adjusting The Size Of Points In Your R Plot With ggplot2
In this case, you will want to adjust the size of the points in your scatterplot. You can do this with the size argument:
chol <- read.table(url("http://assets.datacamp.com/blog_assets/chol.txt"), header = TRUE)
ggplot(chol,
       aes(x=chol$WEIGHT, y=chol$HEIGHT),
       size = 2) +
  geom_point()
#or
ggplot(chol,
       aes(x=chol$WEIGHT, y=chol$HEIGHT)) +
  geom_point(size = 2)
9. How To Fit A Smooth Curve To Your R Data
The loess() function is probably every R programmer’s favorite solution for this kind of question. It actually “fits a polynomial surface determined by one or more numerical predictors, using local fitting”.
In short, you have your data:
x <- 1:10
y <- c(2,4,6,8,7,12,14,16,18,20)
And you use the loess() function, in which you correlate y and x. Through this, you specify the numeric response and one to four numeric predictors:
lo <- loess(y~x) ### estimations between data
You plot x and y:
plot(x,y)
And you plot lines in the original plot where you predict the values of lo:
lines(predict(lo))
Which gives you the following plot:
![Rplot22]()
10. How To Add Error Bars In An R Plot
Drawing Error Bars With Basic R
The bad news: R can’t draw error bars just like that. The good news: you can still draw the error bars without needing to install extra packages!
#Load the data
chol <- read.table(url("http://assets.datacamp.com/blog_assets/chol.txt"), header = TRUE)
#Calculate some statistics for the chol dataset
library(Rmisc)
cholc <- summarySE(chol,
                   measurevar="CHOL",
                   groupvars=c("MORT","SMOKE"))
#Plot the data
plot(cholc$N,
     cholc$CHOL,
     ylim=range(c(cholc$CHOL-cholc$sd, cholc$CHOL+cholc$sd)),
     pch=19,
     xlab="Cholesterol Measurements",
     ylab="Cholesterol Mean +/- SD",
     main="Scatterplot With sd Error Bars"
)

#Draw arrows of a "special" type
arrows(cholc$N,
       cholc$CHOL-cholc$sd,
       cholc$N,
       cholc$CHOL+cholc$sd,
       length=0.05,
       angle=90,
       code=3)
If you want to read up on all the arguments that arrows() can take, go here.
Drawing Error Bars With ggplot2
Error Bars Representing Standard Error Of Mean
First summarize your data with the summarySE() function from the Rmisc package:
#Load in the data
chol <- read.table(url("http://assets.datacamp.com/blog_assets/chol.txt"), header = TRUE)
#Calculate some statistics for the chol dataset
library(Rmisc)
cholc <- summarySE(chol,
                   measurevar="CHOL",
                   groupvars=c("MORT","SMOKE"))
Then, you can use the resulting dataframe to plot some of the variables, drawing error bars for them at the same time, with, for example, the standard error of mean:
![Rplot23]()
If you want to change the position of the error bars, for example, when they overlap, you might consider using the position_dodge() function:
#Load in the data
chol <- read.table(url("http://assets.datacamp.com/blog_assets/chol.txt"), header = TRUE)
#Calculate some statistics for the chol dataset
library(Rmisc)
cholc <- summarySE(chol,
                   measurevar="CHOL",
                   groupvars=c("MORT","SMOKE"))
#Plot the cholc dataset
library(ggplot2)
pd <- position_dodge(0.1)
ggplot(cholc, aes(x=SMOKE, y=CHOL, colour=MORT)) +
    geom_errorbar(aes(ymin=CHOL-se, ymax=CHOL+se, group=MORT),
                  width=.1,
                  position=pd) +
    geom_line(aes(group=MORT)) +
    geom_point()
![Rplot24]()
Tip: if you get an error like “geom_path: Each group consist of only one observation. Do you need to adjust the group aesthetic?”, it usually requires you to adjust the group aesthetic.
Error Bars Representing Confidence Intervals
Continuing from the summary of your data that you made with the summarySE() function, you can also draw error bars that represent confidence intervals. In this case, a plot with error bars of 95% confidence are plotted.
#Load in the data
chol <- read.table(url("http://assets.datacamp.com/blog_assets/chol.txt"), header = TRUE)
#Calculate some statistics for the chol dataset
library(Rmisc)
cholc <- summarySE(chol,
                   measurevar="CHOL",
                   groupvars=c("MORT","SMOKE"))
#Plot the cholc dataset
library(ggplot2)
pd <- position_dodge(0.1)
ggplot(cholc, aes(x=SMOKE, y=CHOL, colour=MORT)) +
    geom_errorbar(aes(ymin=CHOL-ci, ymax=CHOL+ci, group=MORT),
                  width=.1,
                  colour="black",
                  position=pd) +
    geom_line(aes(group=MORT)) +
    geom_point()
![Rplot25]()
Note how the color of the error bars is now set to black with the colour argument.
Error Bars Representing The Standard Deviation
Lastly, you can also use the results of the summarySE() function to plot error bars that represent the standard deviation. Specifically, you would just have to adjust the ymin and ymax arguments that you pass to geom_errorbar():
#Load in the data
chol <- read.table(url("http://assets.datacamp.com/blog_assets/chol.txt"), header = TRUE)
#Calculate some statistics for the chol dataset
library(Rmisc)
cholc <- summarySE(chol,
                   measurevar="CHOL",
                   groupvars=c("MORT","SMOKE"))
#Plot the cholc dataset
library(ggplot2)
pd <- position_dodge(0.1)
ggplot(cholc, aes(x=SMOKE, y=CHOL, colour=MORT)) +
    geom_errorbar(aes(ymin=CHOL-sd, ymax=CHOL+sd, group=MORT),
                  width=.1,
                  position=pd) +
    geom_line(aes(group=MORT)) +
    geom_point()
Big tip: also take a look at this for more detailed examples on how to plot means and error bars.
11. How To Save A Plot As An Image On Disc
You can use dev.copy() to copy your graph, made in the current graphics device to the device or folder specified by yourself.
x <- seq(0,2*pi,0.1)
y <- sin(x)
plot(x,y)
dev.copy(jpeg,
         filename="<path to your file/name.jpg>");
dev.off();
(x)
(y)
12. How To Plot Two R Plots Next To Each Other?
How To Plot Two Plots Side By Side Using Basic R
You can do this with basic R commands:
d0 <- matrix(rnorm(15), ncol=3)
d1 <- matrix(rnorm(15), ncol=3)

limits <- range(d0,d1) #Set limits

par(mfrow = c(1, 2))
boxplot(d0,
        ylim=limits)
boxplot(d1,
        ylim=limits)
By adding the par() function with the mfrow argument, you specify a vector, which in this case contains 1 and 2: all figures will then be drawn in a 1-by-2 array on the device by rows (mfrow). In other words, the boxplots from above will be printed in one row inside two columns.
How To Plot Two Plots Next To Each Other Using ggplot2
If you want to put plots side by side and if you don’t want to specify limits, you can consider using the ggplot2 package to draw your plots side-by-side:
#Load in the data
chol <- read.table(url("http://assets.datacamp.com/blog_assets/chol.txt"), header = TRUE)
#Calculate some statistics for the chol dataset
library(Rmisc)
cholc <- summarySE(chol,
                   measurevar="CHOL",
                   groupvars=c("MORT","SMOKE"))
#Plot the cholc dataset
library(ggplot2)
ggplot(cholc, aes(x=SMOKE, y=CHOL, colour=MORT)) +
  geom_errorbar(aes(ymin=CHOL-sd, ymax=CHOL+sd, group=MORT),
                width=.1,
                position=pd) +
  geom_line(aes(group=MORT)) +
  geom_point() +
  facet_grid(. ~ MORT)
![Rplot26]()
Note how you just add the facet_grid() function to indicate that you want two plots next to each other. The element that is used to determine how the plots are drawn, is MORT, as you can well see above!
How To Plot More Plots Side By Side Using gridExtra
To get plots printed side by side, you can use the gridExtra package; Make sure you have the package installed and activated in your workspace and then execute something like this:
library(gridExtra)
plot1 <- qplot(1)
plot2 <- qplot(1)
grid.arrange(plot1,
             plot2,
             ncol=2)
Note how here again you determine how the two plots will appear to you thanks to the ncol argument.
How To Plot More Plots Side By Side Using lattice
Just like the solution with ggplot2 package, the lattice package also doesn’t require you to specify limits or the way you want your plots printed next to each other.
Instead, you use bwplot() to make trellis graphs with the graph type of a box plot. Trellis graphs display a variable or the relationship between variables, conditioned on one or more other variables.
In this case, if you’re using the chol data set (which you can find here or load in with the read.table() function given below), you display the variable CHOL separately for every combination of factor SMOKE and MORT levels:
#Load in the data
chol <- read.table(url("http://assets.datacamp.com/blog_assets/chol.txt"), header = TRUE)
#Plot two plots side by side
library(lattice)
bwplot(~ CHOL|SMOKE+MORT,
       chol)
![Rplot27]()
Plotting Plots Next To Each Other With gridBase
Another way even to put two plots next to each other is by using the gridBase package, which takes care of the “integration of base and grid graphics”. This could be handy when you want to put a basic R plot and a ggplot next to each other.
You work as follows: first, you activate the necessary packages in your workspace. In this case, you want to have gridBase ready to put the two plots next to each other and grid and ggplot2 to actually make your plots:
library(grid)
library(gridBase)
library(ggplot2)
plot.new()
gl <- grid.layout(nrow=1,
                  ncol=2)
vp.1 <- viewport(layout.pos.col=1,
                 layout.pos.row=1)
vp.2 <- viewport(layout.pos.col=2,
                 layout.pos.row=1)
pushViewport(viewport(layout=gl))
pushViewport(vp.1)
par(new=TRUE,
    fig=gridFIG())
plot(x = 1:10,
     y = 10:1)
popViewport()
pushViewport(vp.2)
ggplotted <- qplot(x=1:10,y=10:1, 'point')
print(ggplotted, newpage = FALSE)
popViewport(1)
![Rplot28]()
If you want and need it, you can start an empty plot:
plot.new()
To then set up the layout:
gl <- grid.layout(nrow=1,
                  ncol=2)
Note that since you want the two plots to be generated next to each other, this requires you to make a grid layout consisting of one row and two columns.
Now, you want to fill up the cells of the grid with viewports. These define rectangular regions on your graphics device with the help of coordinates within those regions. In this case, it’s much more handy to use the specifications of the grid that have just been described above rather than real x-or y-coordinates. That is why you should use the layout.pos.col and layout.pos.row arguments:
vp.1 <- viewport(layout.pos.col=1,
                 layout.pos.row=1)
vp.2 <- viewport(layout.pos.col=2,
                 layout.pos.row=1)
Note again that since you want the two plots to be generated next to each other, you want to put one plot in the first column and the other in the second column, both located on the first row.
Since the viewports are only descriptions or definitions, these kinds of objects need to be pushed onto the viewport tree before you can see any effect on the drawing. You want to use the pushViewport() function to accomplish this:
pushViewport(viewport(layout=gl))
Note the pushViewport() function takes the viewport() function, which in itself contains a layout argument. This last argument indicates “a grid layout object which splits the viewport into subregions”.
Remember that you started out making one of those objects.
Now you can proceed to adding the first rectangular region vp.1 to the ViewPort tree:
pushViewport(vp.1)
After which you tell R with gridFig() to draw a base plot within a grid viewport (vp.1, that is). The fig argument normally takes the coordinates of the figure region in the display region of the device. In this case, you use the fig argument to start a new plot, adding it to an existing plot use by adding new = TRUE in the par() function as well. You plot the base graphic and remove the viewport from the tree:
par(new=TRUE,
    fig=gridFIG())
plot(x = 1:10,
     y = 10:1)
popViewport()
Note that you can specify in the popViewport() function an argument to indicate how many viewports you want to remove from the tree. If this value is 0, this indicates that you want to remove the viewports right up to the root viewport. The default value of this argument is 1.
Go to add the second rectangular region vp.2 to the ViewPort tree. You can then make the ggplot and remove the viewport from the tree.
pushViewport(vp.2)
ggplotted <- qplot(x=1:10,
                   y=10:1,
                   'point')
print(ggplotted,
      newpage = FALSE)
popViewport(1)
Note that you need to print to print the graphics object made by qplot() in order to actually draw it and get it displayed. At the same time, you also want to specify newpage = FALSE, otherwise you’ll only see the qplot()…
Also remember that the default value of viewports to remove in the function popViewport() is set at 1. This makes it kind of redundant to put popViewport(1) in the code.
13. How To Plot Multiple Lines Or Points?
Using Basic R To Plot Multiple Lines Or Points In The Same R Plot
To plot two or more graphs in the same plot, you basically start by making a usual basic plot in R. An example of this could be:
x <- seq(0,pi,0.1)
y1 <- cos(x)
plot(x,
     y1,
     type="l",
     col = "red")
Then, you start adding more lines or points to the plot. In this case, you add more lines to the plot, so you’ll define more y axes:
y2 <- sin(x)
y3 <- tan(x)
y4 <- log(x)
Then, you plot these y axes with the use of the lines() function:
lines(x,y2,col="green")
lines(x,y2,col="green")
lines(x,y3,col="black")
lines(x,y4,col="blue")
This gives the following result:
![Rplot29]()
Note that the lines() function takes in three arguments: the x-axis and the y-axis that you want to plot and the color (represented with the argument col) in which you want to plot them. You can also include the following features:
| Feature |
Argument |
Input |
| Line type |
lty |
Integer or character string |
| Line width |
lwd |
Integer |
| Plot type |
pch |
Integer or single character |
| Line end style |
lend |
Integer or string |
| Line join style |
ljoin |
Integer or string |
| Line mitre limit |
lmitre |
Integer < 1 |
Here are some examples:
lines(x,y2,col="green", lty = 2, lwd = 3)
lines(x,y2,col="green", lty = 5, lwd = 2, pch = 2)
lines(x,y3,col="black", lty = 3, lwd = 5, pch = 3, lend = 0, ljoin = 2)
lines(x,y4,col="blue", lty = 1, lwd = 2, pch = 3, lend = 2, ljoin = 1, lmitre = 2)
Note that the pch argument does not function all that well with the lines() function and that it’s best to use it only with points().
Tip: if you want to plot points in the same graph, you can use the points() function:
y5 <- x^3
points(x,
       y5,
       col="yellow")
You can add the same arguments to the points() function as you did with the lines() function and that are listed above. There are some additions, though:
| Feature |
Argument |
Input |
| Background (fill) color |
bg |
Only if pch = 21:25 |
| Character (or symbol) expansion |
cex |
Integer |
Code examples of these arguments are the following:
points(x,y4,col="blue", pch=21, bg = "red")
points(x, y5, col="yellow", pch = 5, bg = "blue")
If you incorporate these changes into the plot that you see above, you will get the following result:
x <- seq(0,pi,0.1)
y1 <- cos(x)
plot(x,y1,type="l" ,col = "red") #basic graphical object
y2 <- sin(x)
y3 <- tan(x)
y4 <- log(x)
y5 <- x^3
lines(x,y2,col="green", lty = 1, lwd = 3) #first layer
lines(x,y2,col="green", lty = 3, lwd = 2, pch = 2) #second layer
lines(x,y3,col="black", lty = 2, lwd = 1, pch = 3, lend = 0, ljoin = 2) #third layer
points(x,y4,col="blue", pch=21, bg = "red") #fourth layer
points(x, y5, col="yellow", pch = 24, bg = "blue") #fifth layer
![Rplot30]()
Using ggplot2 To Plot Multiple Lines Or Points In One R Plot
The ggplot2 package conveniently allows you to also create layers, which allows you to basically plot two or more graphs into the same R plot without any difficulties and pretty easily:
library(ggplot2)
x <- 1:10
y1 <- c(2,4,6,8,7,12,14,16,18,20)
y2 <- rnorm(10, mean = 5)
df <- data.frame(x, y1, y2)
ggplot(df, aes(x)) +  # basic graphical object
  geom_line(aes(y=y1),
            colour="red") +  # first layer
  geom_line(aes(y=y2),      # second layer
            colour="green")
14. How To Fix The Aspect Ratio For Your R Plots
If you want to put your R plot to be saved as an image where the axes are proportional to their size, it’s a sign that you want to fix the aspect ratio.
Adjusting The Aspect Ratio With Basic R
When you’re working with basic R commands to produce your plots, you can add the argument asp of the plot() function, completed with an integer, to set your aspect ratio. Look at this first example without a defined aspect ratio:
x <- seq(0,2*pi,0.1)
y <- sin(x)
plot(x,y)
![Rplot31]()
And compare this now to the plot where the aspect ratio is defined with the argument asp:
x <- seq(0,2*pi,0.1)
y <- sin(x)
plot(x,
     y,
     asp=2)
![Rplot32]()
Adjusting The Aspect Ratio For Your Plots With ggplot2
To fix the aspect ratio for ggplot2 plots, you just add the function coord_fixed(), which provides a “fixed scale coordinate system [that] forces a specified ratio between the physical representation of data units on the axes”.
In other words, this function allows you to specify a number of units on the y-axis which is equivalent to one unit on the x-axis. The default is always set at 1, which means that one unit on the x-axis has the same length as one unit on the y-axis. If your ratio is set at a higher value, the units on the y-axis are longer than units on the x-axis and vice versa.
Compare the following examples:
library(ggplot2)
df <- data.frame(
  x = runif(100, 0, 5),
  y = runif(100, 0, 5))

ggplot(df, aes(x=x, y=y)) + geom_point()
![Rplot33]()
versus
library(ggplot2)
df <- data.frame(
  x = runif(100, 0, 5),
  y = runif(100, 0, 5))

ggplot(df, aes(x=x, y=y)) +
  geom_point() +
  coord_fixed(ratio=1)
![Rplot34]()
Adjusting The Aspect Ratio For Your Plots With MASS
You can also consider using the MASS package, which encompasses the eqscplot() function: it produces plots with geometrically equal scales. It does this for scatterplots:
chol <- read.table(url("http://assets.datacamp.com/blog_assets/chol.txt"), header = TRUE)
library(MASS)
x = chol$HEIGHT
y = chol$WEIGHT
z = as.numeric(chol$MORT)

eqscplot(x,
         y,
         ratio = 1,
         col=c("red", "green"),
         pch=c(1,2))
![Rplot35]()
Tip: you might do well starting a new plot frame before executing the code above!
Note that you can give additional arguments to the eqscplot() function to customize the scatterplot’s look!
15. What Is The Function Of hjust And vjust In ggplot2?
Well, you basically use these arguments when you want to set the position of text in your ggplot. hjust allows you to define the horizontal justification, while vjust is meant to control the vertical justification. See the documentation on geom_text() for more information.
To demonstrate what exactly happens, you can create a data frame from all combinations of factors with the expand.grid() function:
hjustvjust <- expand.grid(hjust=c(0, 0.5, 1),
                          vjust=c(0, 0.5, 1),
                          angle=c(0, 45, 90),
                          text="Text"
                          )
Note that hjust and vjust can only take values between 0 and 1.
0 means that the text is left-justified; In other words, all text is aligned to the left margin. This is usually what you see when working with text editors such as Word.1 means that the text is right-justified: all text is aligned to the right margin.
Then, you can plot the data frame that you have just made above with the ggplot() function, defining the x-and y-axis as “hjust” and “vjust” respectively:
library(ggplot2)
ggplot(hjustvjust, aes(x=hjust, y=vjust)) +
    geom_point() +
    geom_text(aes(label=text,
                  angle=angle,
                  hjust=hjust,
                  vjust=vjust)) +
    facet_grid(~angle) +
    scale_x_continuous(breaks=c(0, 0.5, 1),
                       expand=c(0, 0.2)) +
    scale_y_continuous(breaks=c(0, 0.5, 1),
                       expand=c(0, 0.2))
![Rplot36]()
Also note how the hjust and vjust arguments are added to geom_text(), which takes care of the textual annotations to the plot.
In the plot above you see that the text at the point (0,0) is left-aligned, horizontally as well as vertically. On the other hand, the text at point (1,1) is right-aligned in horizontal as well as vertical direction. The point (0.5,0.5) is right in the middle: it’s not really left-aligned nor right-aligned for what concerns the horizontal and vertical directions.
Note that when these arguments are defined to change the axis text, the horizontal alignment for axis text is defined in relation to the entire plot, not to the x-axis!
DF <- data.frame(x=LETTERS[1:3],
                 y=1:3)
p <- ggplot(DF, aes(x,y)) +
  geom_point() +
  ylab("Very long label for y") +
  theme(axis.title.y=element_text(angle=0))


p1 <- p + theme(axis.title.x=element_text(hjust=0)) + xlab("X-axis at hjust=0")
p2 <- p + theme(axis.title.x=element_text(hjust=0.5)) + xlab("X-axis at hjust=0.5")
p3 <- p + theme(axis.title.x=element_text(hjust=1)) + xlab("X-axis at hjust=1")

library(gridExtra)
grid.arrange(p1, p2, p3)
![Rplot37]()
Also try for yourself what defining the vjust agument to change the axis text does to the representation of your plot:
DF <- data.frame(x=c("ana","b","cdefghijk","l"),
                 y=1:4)
p <- ggplot(DF, aes(x,y)) + geom_point()

p1 <- p + theme(axis.text.x=element_text(vjust=0, colour="red")) +
        xlab("X-axis labels aligned with vjust=0")
p2 <- p + theme(axis.text.x=element_text(vjust=0.5, colour="red")) +
        xlab("X-axis labels aligned with vjust=0.5")
p3 <- p + theme(axis.text.x=element_text(vjust=1, colour="red")) +
        xlab("X-axis labels aligned with vjust=1")


library(gridExtra)
grid.arrange(p1,p2,p3)
To go to the original excellent discussion, from which the code above was adopted, click here.
As A Last Note…
It’s really worth checking out this article, which lists 10 tips for making your R graphics look their best!
Also, if you want to know more about data visualization, you might consider checking out DataCamp’s interactive course on data visualization with ggvis, given by Garrett Grolemund, author of Hands on Programming with R, as well as Data Science with R.
Or maybe our course on reporting with R Markdown can interest you!


The post 15 Questions All R Users Have About Plots appeared first on The DataCamp Blog .
To
leave a comment for the author, please follow the link and comment on his blog:
The DataCamp Blog » R.
R-bloggers.com offers
daily e-mail updates about
R news and
tutorials on topics such as: visualization (
ggplot2,
Boxplots,
maps,
animation), programming (
RStudio,
Sweave,
LaTeX,
SQL,
Eclipse,
git,
hadoop,
Web Scraping) statistics (
regression,
PCA,
time series,
trading) and more...


 ,
, is a random effect for the i-th group. A pooled OLS regression model for the above is unbiased and consistent. However, it will be inefficient, unless
  for all
  .
. ,
,") and
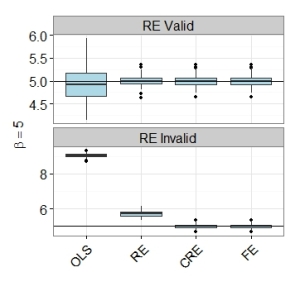
and ") . I will do this simulation and compare the following 4 estimators: pooled OLS, random effects (RE) AKA a multilevel model with a mixed effect intercept, a correlated random effects (CRE) model (include group mean as regressor as in Mundlak (1978)), and finally the regular fixed effects (FE) model. I am doing this in R, so the first model I will use the simple lm() function, the second and third lmer() from the lme4 package, and finally the excellent felm() function from the lfe package. These models will be tested under two conditions. First, we will assume that the random effects assumption holds, the regressor is uncorrelated with the random effect. After looking at this, we will then allow the random effect to correlate with the regressor
. I will do this simulation and compare the following 4 estimators: pooled OLS, random effects (RE) AKA a multilevel model with a mixed effect intercept, a correlated random effects (CRE) model (include group mean as regressor as in Mundlak (1978)), and finally the regular fixed effects (FE) model. I am doing this in R, so the first model I will use the simple lm() function, the second and third lmer() from the lme4 package, and finally the excellent felm() function from the lfe package. These models will be tested under two conditions. First, we will assume that the random effects assumption holds, the regressor is uncorrelated with the random effect. After looking at this, we will then allow the random effect to correlate with the regressor  .
.